 |||
|||
If you are like me and you have deployed a windows service onto a production server and the CPU on the server spikes randomly then, this post may be helpful in finding the root cause of the problem.
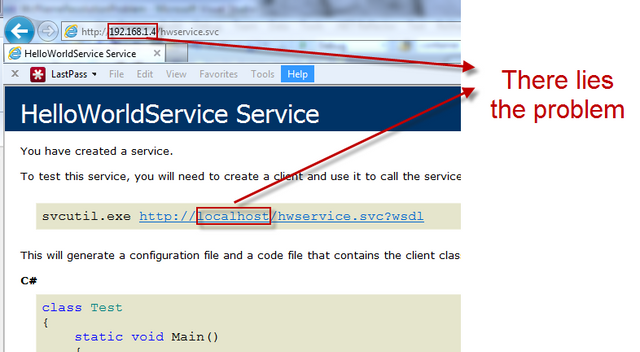
Generally speaking, high CPU usage is indicative of the fact that one or more thread(s) in your application are stuck in some sort of an endless loop, and to bring CPU usage to normal levels you would most likely have to restart your app. This is exactly what happened to my innocent Windows service which was hosting an in-process WCF service to accept two string values from a client and relay that information to a third party API.
To start the diagnosis, I opened up windows task manager to see which process was consuming most of the CPU. Since this was a plain-vanilla Windows 2008 server with no other applications installed; apart from my windows service, it was quite clear that this service was the culprit. The CPU usage was around 90% when i first looked. I then created a dump file for further analysis by right clicking on the process in the task manager.
Since my windows service was a 32 bit process running on a 64 bit machine, i had to use the 32 bit task manager to create the dump file, which was located at C:. The 64 bit task manager lives under C: folder and opens up by default when someone fires it by by right clicking on the task manager. It is very important to get the bitness of the dump file correct and also to debug it in the correct debugger. For example — Things are easier when a 32 bit dump is debugged in a 32 bit version of Windbg.
Three other dlls that are crucial for successfully debugging a dump file are:
The version number of these dlls must be exactly the same on the machine where the dump was created and the machine on which the debugging is performed. I ended up installing 32 bit Windbg on my production server. If you don’t have direct access to your production server, then you could probably ask the system admin of that box, to give you those dlls which you would then have to place in your symbols path folder.
Once everything was setup I hit Ctrl + D to load the dump file from the disk and ran the following commands:
.load sos
In order to understand dumps from managed applications, Windbg needs to load an extension called sos (Son of Strike) into the debugger. sos offers some useful commands that help in dissecting the information contained in the dump file.
.chain
Ran the .chain command to verify that sos was loaded from the correct path. Since my app was targeting .net 3.5, the sos was loaded from C:.NET.0.50727
.time
Next, i ran the .time command to see how much time my service spent in the User mode. It came back with the following stats:

!runaway
!runaway command shows all the threads that my service was running along with their total execution time when i created the dump.

Thread 9 stood out like a sore thumb as it spent 6 minutes and 4 seconds in the user mode out of the total 6 minutes and 18 seconds my service was running in the user mode. This lead me to look closely at thread 9.
~9s
switched the debugger to look at thread 9 only, the prompt changed from 0.000 to 0:009
!pe
prints any exceptions that may have been recorded on the stack trace.

!clrstack
printed the CLR stack using the above command for thread 9, showed me

This indicated that thread 9 is waiting on read method to complete for the last 6 minutes or so. This method existed in the 3rd party library which my service was relaying the data to.
!clrstack –p
revealed the parameter info of every method involved in the stack trace.

!do 0x0185288c
!do is used for dumping object information on screen and in this case i used this command to dump the contents of the 3rd parameter which is of type byte[], it showed:

This lead me to believe that the read method in the Hciformatter class is probably not handling the null stream object very well. So popped open my best mate reflector and looked at the read method code and found the following:

As one of my Aussie mates would say:
Got ya !! you dirty little bugger.